Brain SPECT : improved displays for enhanced results .
Dan G Pavel M.D. Director, PathFinder Brain SPECT Imaging, Deerfield IL 60015
As software capabilities develop, work on quantification techniques is certainly justified. Nonetheless it seems imperative not to lose sight of the need to interpret the individual patient’s images. An improved visualization will go a long way towards improving not only the image interpretation, but also the dialog with referring professionals and with patients. In addition it will go a long way towards further spreading the notion of Brain SPECT as a key functional imaging procedure. To this effect the end result displays should be comprehensive, detailed, precise, consistent and.…user friendly. In other words the end displays should become a most efficient and easy to relate to, communication tool.
There are several ways to look at a brain SPECT: (A) In a static mode (a) using its native image or (b) using its normalized image e.g. after co-registration to a standard atlas / template and, (B) in a dynamic / cinematic mode .
(A) Static mode :
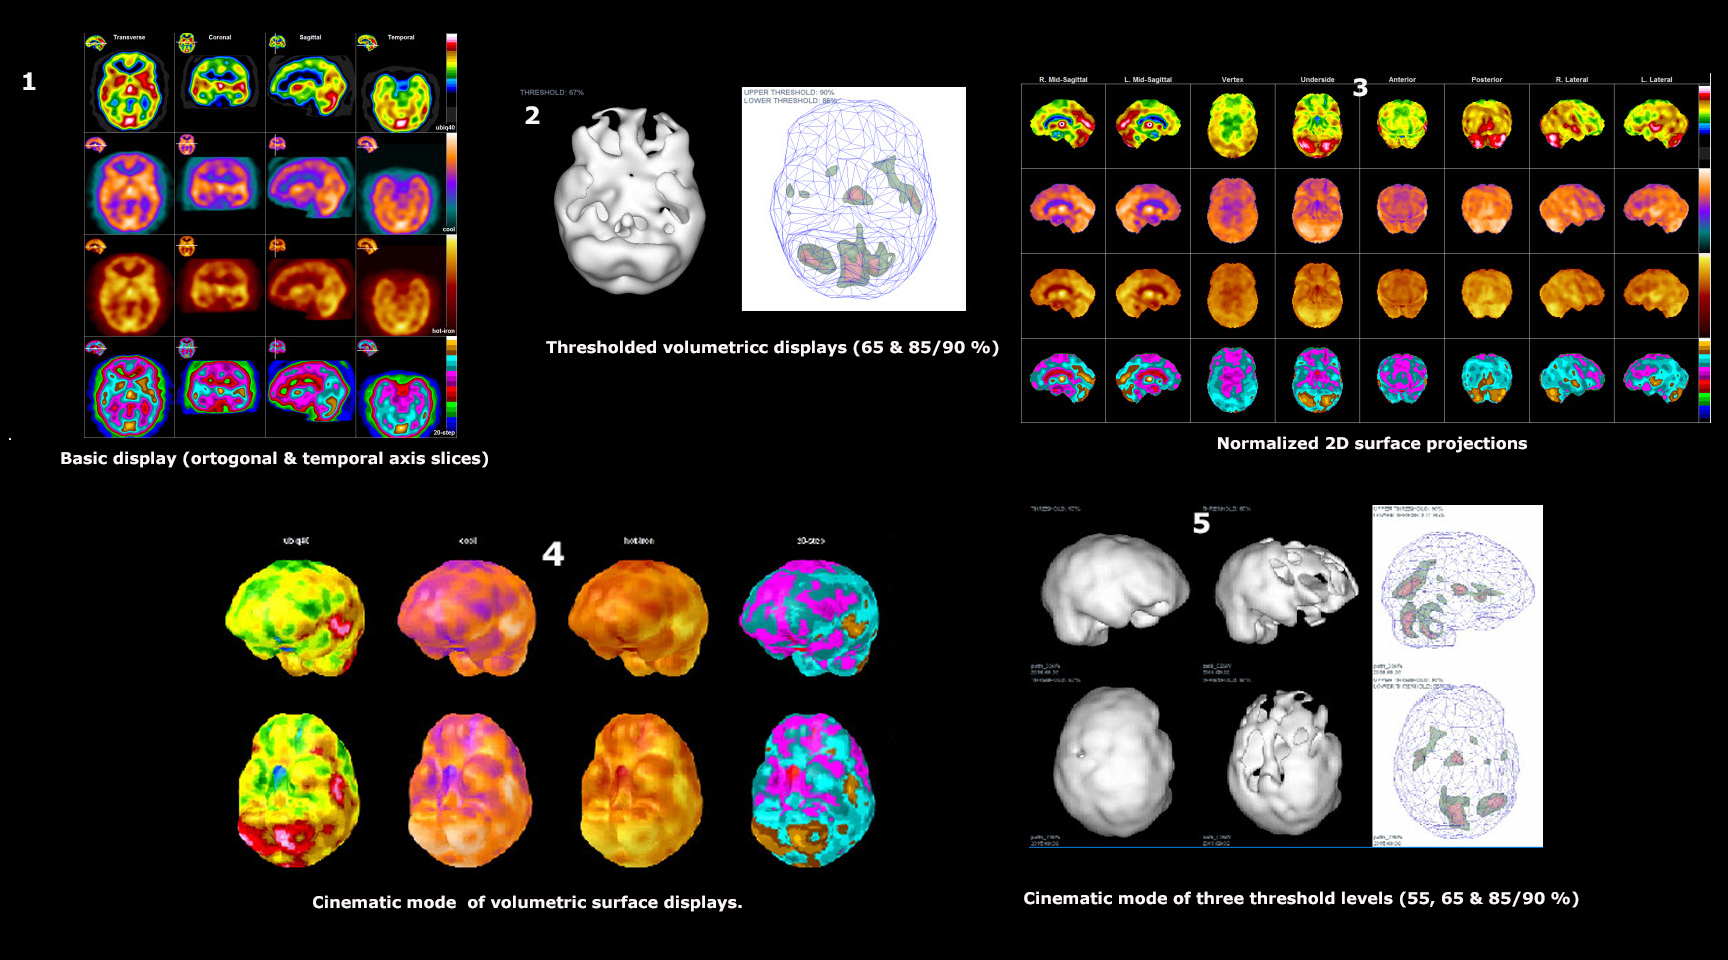
a. Is the basic display of the native images in the form of orthogonal slices ( fig 1 columns 1-3). While this helps in a number of cases there is general agreement that significant improvements can easily be obtained by :
– Using an additional set of slices along the temporal lobes axis (fig 1 column 4) and
– Using thresholded volumetric displays. The most comprehensive way available is an automatic display of 4 standardized thresholds on six views of the brain volume (fig 2 –only 2/4 thresholds and one single view are shown) .
Finally a most significant contribution to the requirements outlined above, is obtained when adding the second type of images .
b. The normalized e.g. template co-registered displays of brain surface and volume. Among their advantages are the ease of discerning features on brain surface projections and volumes This enables a much easier communication between the imaging specialist and the referring physician or patient and family alike . Also the comparison between followup imaging in the same patient or between scans of different patients, is greatly facilitated, given the fact that size / shape will be the same across subjects.
– The original normalization had been to the Talairach atlas as for ex.provided in the Neurostat algorithm (1 ) originally used for statistical analysis . Nonetheless it can also be used for each individual patient’s functional map displayed on eight two dimensional surface projections (fig 3)
– A next step introduced recently (2 ) uses these same Talairach normalized images but for a format of 6 views of volumetric surface display views (fig 4)
– Recently a more detailed brain template called the MNI brain (Montreal Neurological Institute) has become available and theoretically brain SPECT results can also be co-registered to it .
(B) Dynamic /cinematic mode: there are multiple combinations possible and the ones presently
– The cine-display of two of the volumetric-surface projections in the X & Y axis (fig 4).
– A cine-display of three levels of rotating thresholded volumes in the X & Y axis . This enables a pertinent self explanatory evaluation of location and size of cortical as well as subcortical abnormalities (fig 5).
Two more questions need to be addressed :
1.Which color code ? Indeed brain SPECT being a functional imaging, requires color displays which enable semi-quantitative ways of evaluating differential function but, which color ? We selected 4 out of many color schemes : UBIQ a code with an easy to remember sequence of discrete shades (where the U & I stand for University of Illinois), then the so called “ cool” and “hot iron” (continuously transitioning colors) and, the “Picker 20” code .
2. Is this sequence of intricate methods of visualizations applicable in a routine clinical environment? The answer is “yes” because it can be practically done automatically. Indeed, with currently available a technologist is only required to provide two simple inputs : (a) indicate the file location containing the reconstructed / attenuation corrected, sequence of single slice images and (b) select the color code desired (from a list provided on the screen). Subsequently, in less than one minute a 5 page PDF file is available for distribution whether via screen viewing (including full cinematic displays) and /or via printing.
A final thought : better displays and automation will make it much easier to achieve Brain SPECT standardization as well .
(1) Minoshima, S., Koeppe, R.A., Frey, K.A., & Kuhl, D.E. (1994). Anatomical standardization: linear scaling and nonlinear warping of functional brain images. Journal of Nuclear Medicine, 35(9), 1528-1537.
(2) Good Lion Imaging , Columbia MD ; 1.847.987.5216 and :http://www.smartbrief.com/s/2009/03/access-neurostat-3d-ssp-brain-pet-or-spect-analysis
Leave a Reply